Montgomery County Crime Analysis
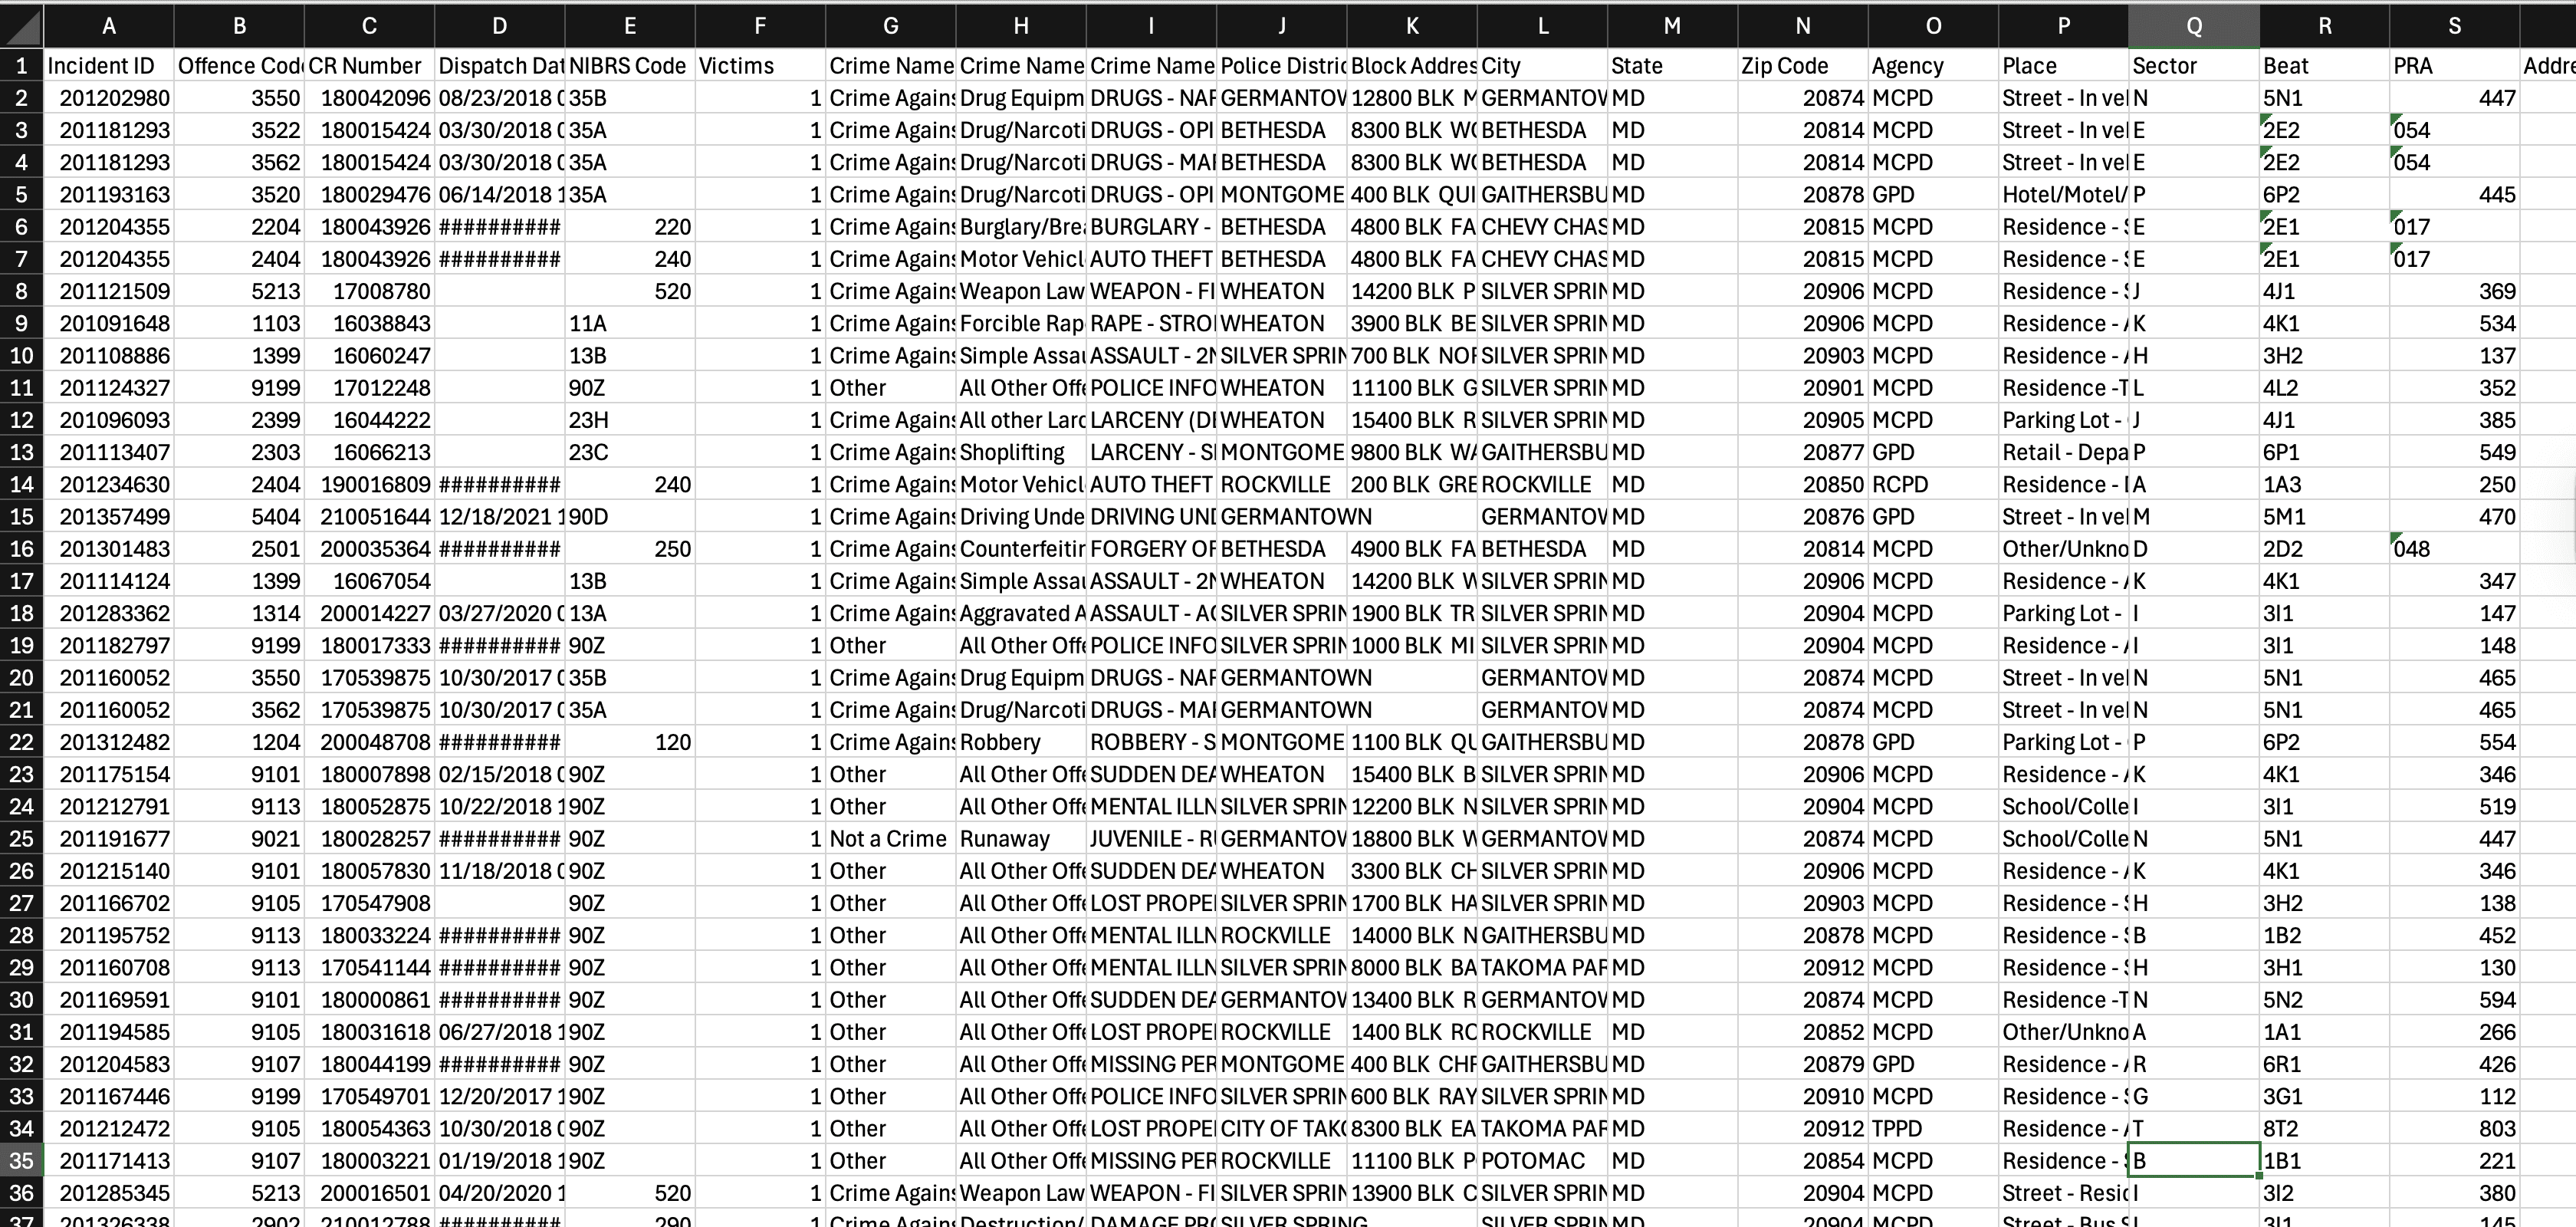
This project explores crime trends in Montgomery County (USA) from 2018–2022, using data science techniques to uncover spatial, temporal, and behavioural patterns. Working with a dataset of over 300,000 crime records, the analysis focused on cleaning, structuring, and visualising the data to reveal insights into crime types, peak times, police district effectiveness, and shifts in criminal activity over the years. My contribution centred on Preliminary Data Analysis (PDA), Exploratory Data Analysis (EDA), and the creation of Python visualisations used throughout the report.